E-commerce
Revolutionizing e-commerce testing with QALIPSIS
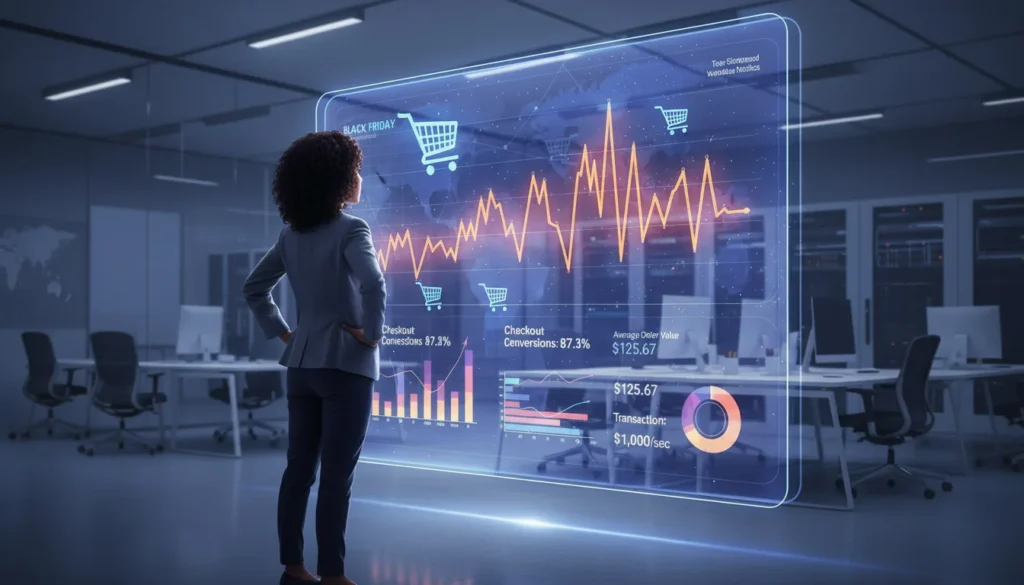
What breaks in your order pipeline when Black Friday traffic hits?
Can your production line detect MQTT latency before it causes defects?

What breaks in your order pipeline when Black Friday traffic hits?

Why do playback failures spike when the CDN still has headroom?
What if every pull request caught performance regressions automatically?