
Must-Use Qalitative Testing
Elit nisi in eleifend sed nisi. Pulvinar at orci, proin imperdiet commodo consectetur convallis risus. Sed condimentum enim dignissim adipiscing faucibus consequat, urna. Viverra…
Designed for distributed and asynchronous systems.
Revolutionizing high load testing for smarter, scalable solution.
QALIPSIS empowers software developers, QA teams, DevOps Engineers and IT operations to test faster, smarter and with pinpoint accuracy.
Elit nisi in eleifend sed nisi. Pulvinar at orci, proin imperdiet commodo consectetur convallis risus. Sed condimentum enim dignissim adipiscing faucibus consequat, urna. Viverra…

Can your IoT platform detect degradation before your customers do?


Chosen by ambitious teams. Backed by strong partners.


QALIPSIS makes testing not just manageable but a breeze.
If the system continues after the call returns, your test must continue too.
A fast response doesn’t guarantee the workflow completed. QALIPSIS makes completion verifiable.
QALIPSIS doesn’t stop at “200 OK”. It verifies messages sent, records written, and async side effects completed – as part of the same load scenario.
That’s the difference between traffic generation and end-to-end system validation.
If you’re comparing QALIPSIS with Grafana k6, Gatling, or Apache JMeter, use the table below to see which solutions can trace workflows across components and validate real outcomes – not just the direct request/response path.
|
QALIPSIS
Grafana k6
Gatling
JMeter
|
||||
|---|---|---|---|---|
| Technology stack support | ||||
|
Purpose-built for distributed & asynchronous systems
Designed from the ground up to test systems where multiple services communicate via APIs, message brokers, and databases — not just HTTP endpoints.
|
Explicitly designed for distributed architectures and asynchronous flows;
scenarios cover REST + messaging + databases as one end-to-end system. |
Primarily web/API load testing
|
General load testing focus;
not built around distributed async system validation as a core thesis. |
General-purpose load testing framework;
not built around distributed async system validation as a core thesis. |
|
Native support for message brokers (beyond HTTP)
Ability to produce and consume messages on brokers like Kafka, RabbitMQ, or JMS as built-in test steps — not just HTTP calls.
|
Message brokers are first-class test targets via plugins (e.g., Kafka/RabbitMQ/JMS/Jakarta EE) and can be part of scenario flows.
|
Supports messaging protocols via built-in modules (notably JMS; other protocols depend on available modules).
|
Supports JMS as test plan steps (samplers).
|
|
|
Native support for databases
Ability to poll, save, or search databases (SQL, NoSQL, time-series) as first-class steps within a load-test scenario.
|
Databases are first-class test targets via plugins: Cassandra, MongoDB, PostgreSQL/MySQL/MariaDB via R2DBC-jasync, Redis (Lettuce), Elasticsearch, TimescaleDB, InfluxDB.
Database steps integrate into scenario flows alongside HTTP and messaging steps. |
Not a built-in capability.
|
Gatling’s own gatling-jdbc artifact provides connection-pool configuration, not a load-test protocol.
|
Built-in JDBC Request sampler supports any JDBC-compatible database (MySQL, PostgreSQL, Oracle, SQL Server, etc.) as a native test-plan element.
|
|
Extensible
Provides a documented plugin or extension API that lets teams add support for custom protocols, proprietary systems, or third-party libraries.
|
You can create your own plugins and bring your own or proprietary libraries.
The architecture supports custom steps, events loggers, and meter registries. |
The xk6 framework lets developers create custom extensions in Go (JavaScript extensions, Output extensions, Secret Source extensions, Subcommand extensions).
Extensions are compiled into a custom k6 binary. |
Custom protocols can be implemented in Scala/Java by extending Gatling’s internal classes; third-party community plugins exist.
However, there is no formally documented, stable public extension API/SDK for creating plugins. |
Java-based plugin architecture with well-documented extension points (Sampler, Listener, Function, Timer interfaces).
JMeter Plugins Manager simplifies discovery and installation of community plugins. |
| Complex workflows | ||||
|
End-to-end workflow tracing across requests + messages + records
Correlates a single business transaction across HTTP calls, broker messages, and database records — tracking it from start to finish with shared identifiers.
|
Traces use correlation IDs, origin markers, and timestamps;
they appear in logs and in analytics events/data. |
No native cross-component workflow tracing model.
|
No native cross-component workflow tracing model.
|
No native cross-component workflow tracing model.
|
|
Off-path Outcome Verification
Validates outcomes that occur outside the direct request/response path — e.g., checking that a message landed in a queue or a record was written to a database after an API call.
|
Collects system/application data as analytics events and validates it inside the load workflow with standard assertions.
|
Can only validate what it directly executes/observes;
does not natively collect arbitrary system data for validation. |
Can only validate outcomes within what it directly drives via supported protocols;
captures detailed protocol-level metrics and can assert on in-scope protocol interactions. |
Can only validate outcomes of what it directly drives (e.g., protocol samplers);
captures sampler results and can query some systems (e.g., via JDBC/JMS) for checks. |
| Scalability and deployment | ||||
|
Distributed execution architecture
Runs load generation across multiple coordinated nodes with built-in orchestration, failure handling, and result aggregation.
|
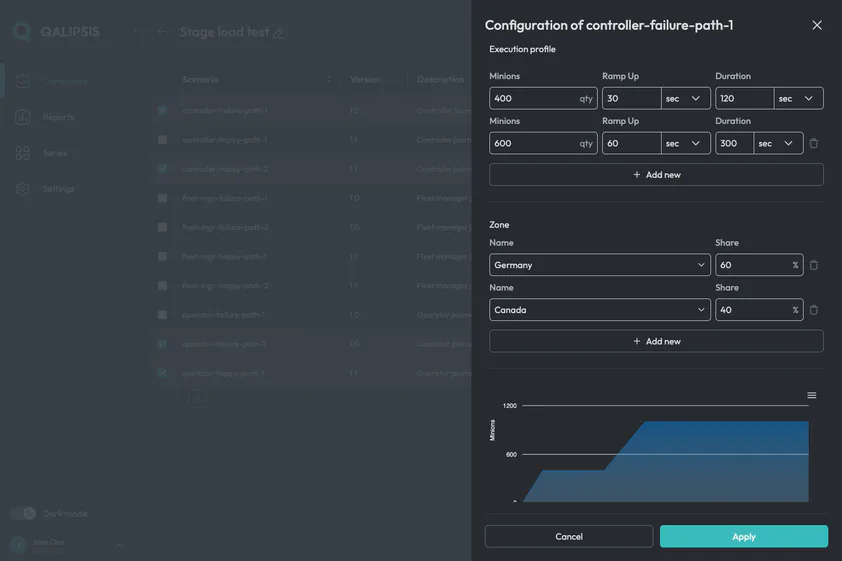
Minions distributed by zones, then evenly across factories in-zone.
Workflow failures are treated as normal outcome states and reported as dedicated analytics events. Aggregation available by campaign/scenario/zones. |
Supports scaling execution (depending on deployment), but no native orchestration model with zone-based minion distribution and analytics-event outcome modeling.
|
Supports distributed runs (deployment/edition dependent), but no native orchestration model with zone-based minion distribution and analytics-event outcome modeling.
|
Distributed mode exists, but scaling is constrained by tight controller/remote-engine coupling
(controller coordination can become a bottleneck and adds operational friction at high scale). |
|
Geo / zone-based load segmentation
Assigns load generators to named zones (geographic regions or network segments) and segments both execution and reporting by zone.
|
Zones can represent physical regions (countries/continents) or logical zones (IT networks);
zones drive both minion distribution and aggregation slices. |
|||
|
CI/CD-native interfaces
Offers CLI, API, or build-tool integrations that let load tests run unattended in CI/CD pipelines with repeatable, automatable execution.
|
CLI + REST API + Gradle-based build tool integration;
intended for pipeline execution and repeatability. |
CLI-first execution model suitable for CI pipelines.
|
Code-first simulations suitable for CI pipelines.
|
CLI (non-GUI) execution is standard for automation.
|
| Reporting and analytics | ||||
|
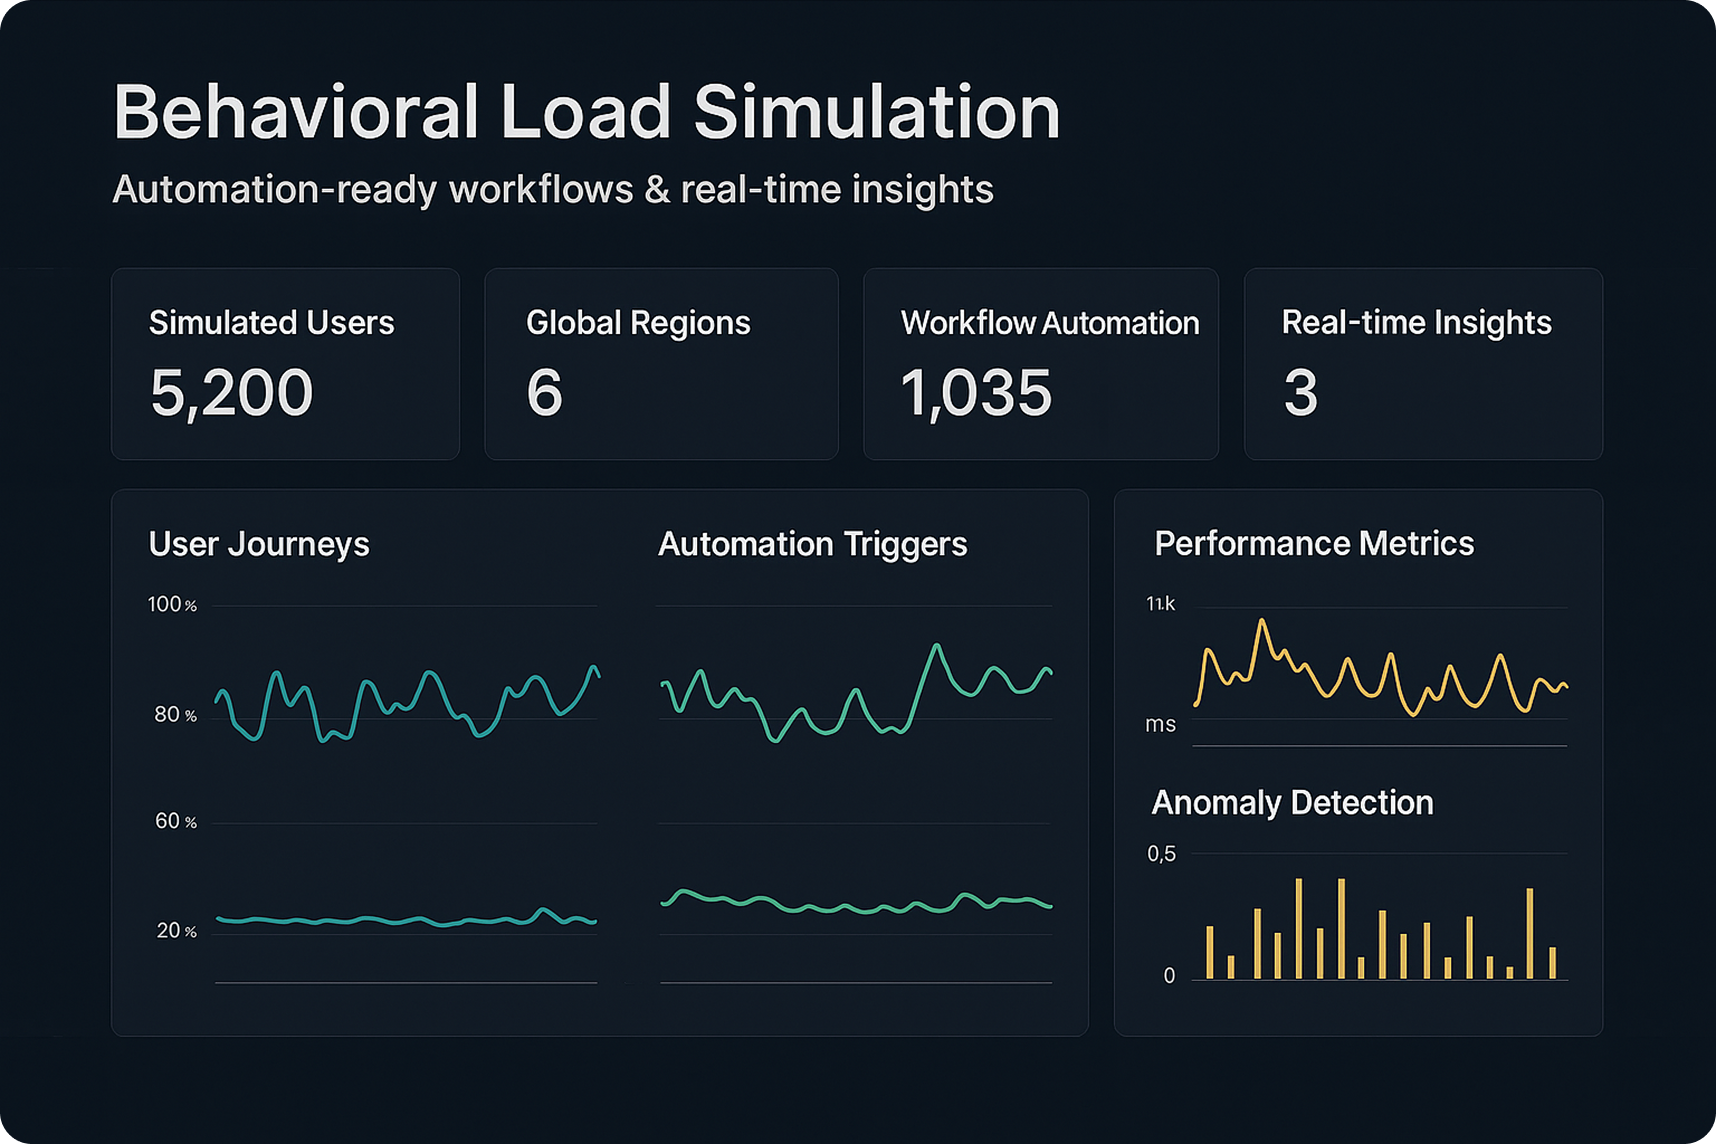
Live monitoring
Provides real-time visibility into test metrics — throughput, latency, success/failure rates — while a campaign is still running.
|
In standalone mode, a live console report shows real-time campaign metrics, per-scenario success/failure counts, and published step metrics.
The GUI displays in-process campaign results in real time on an interactive time-series chart. Meters and events can also be streamed to external systems (Elasticsearch, InfluxDB, Graphite, TimescaleDB, Kafka) for live dashboarding and alerting. |
Built-in web dashboard provides real-time metrics visualization in-browser during test execution.
Metrics can also be streamed to Grafana via InfluxDB, Prometheus remote-write, or other outputs for live dashboarding. |
OSS provides live console output only;
real-time interactive dashboards require Gatling Enterprise (commercial) or streaming metrics via the built-in Graphite writer to InfluxDB + Grafana. |
GUI listeners (e.g., View Results Tree, Summary Report) show results during execution but are not recommended under load.
|
|
Customizable reports
Lets users tailor post-test reports — filtering by scenario, adding metadata, or choosing output formats — rather than relying on a fixed report template.
|
The GUI supports creating/downloading campaign reports with scenario-level filtering.
Exported analytics data can be tagged with custom metadata (environment, team, project) and shaped into custom dashboards via third-party tools. |
Allows fully custom end-of-test reports in any text format (HTML, JSON, XML, etc.).
|
OSS generates static non-customizable HTML reports.
|
The built-in HTML Dashboard Report generator is customizable via configuration and templating.
|
|
Analytics Export & Dashboarding
Streams or exports test analytics to external data stores and BI tools for custom dashboards, historical trending, and cross-team reporting.
|
Exports analytics data to third-party systems (e.g., Elasticsearch, InfluxDB, Graphite, TimescaleDB, Kafka) and supports dashboarding via independent tools (e.g., PowerBI, Tableau).
|
Exports metrics to supported outputs/backends;
dashboarding typically relies on external tools but is centered on metric streams rather than a richer analytics-event model. |
Reporting/export exists;
integration is typically report/metrics-oriented rather than a unified analytics-event export stream. |
Can export results via listeners/backends;
dashboarding relies on external tools and the chosen result backend. |

Gain deep insights into system performance with live monitoring of logs, CPU, memory, and disk usage. Detect bottlenecks early and troubleshoot faster by understanding the root causes of issues.

Unlike traditional load testing solutions that only stress-test isolated components, QALIPSIS validates entire distributed systems – including databases, messaging platforms, and microservices. It also supports asynchronous and event-driven architectures, ensuring comprehensive test coverage and using internal system data for assertions.

QALIPSIS is the first performance and load testing solution built for DevOps. With its CLI, REST API and Gradle plugin, it integrates effortlessly into CI/CD workflows, enabling automated performance validation and continuous optimization

Simulate millions of concurrent users across multiple geographical locations, replicating real-world behavioral patterns to test your system under true-to-life conditions.

Instead of just sending bulk requests, QALIPSIS allows you to define complex user journeys, validate system interactions, and analyze performance trends over time – ensuring a realistic and actionable testing approach.

QALIPSIS generates load from multiple locations worldwide by deploying factory nodes across any combination of on-premise infrastructure, private clouds, AWS Regions, or Azure availability zones — making it a natural fit for hybrid cloud and multi-cloud architectures — helping you assess performance based on regional demand and infrastructure.

Go beyond HTTP and REST – QALIPSIS supports messaging queues, databases, WebSockets, and any Java-compatible system. It can even be extended to proprietary technologies, offering unmatched flexibility.

Deploy on-premise, in the cloud, or within containers, adapting to your infrastructure and budget requirements. Scale effortlessly by adding more QALIPSIS nodes as needed.
Discover how businesses leveled up their testing, cut costs and delivered rock-solid, scalable applications with QALIPSIS.


Users define test scenarios using QALIPSIS’s domain-specific language (DSL) based on Kotlin, specifying the sequence of actions, data inputs, and expected outcomes.

Set performance thresholds and automatically detect slowdowns, failures, or unexpected behaviors during test execution.

The defined scenarios are executed by QALIPSIS, which simulates the specified user behaviors and interactions with the system under test.

Throughout the execution, QALIPSIS collects and displays real-time metrics, allowing users to monitor system performance.

After execution, detailed reports and dashboards are created, enabling users to analyze results, identify issues, and make informed decisions for system optimization.